Once a campaign starts running — or a broadcast is sent — Customer.io begins tracking performance so you can see what’s working and where people drop off.
You’ll see metrics in a few places:
-
Dashboard: High-level performance across all messaging
-
Campaign Overview: Summary performance for one campaign
-
Metrics tab: Deeper detail on journeys and message performance
-
Workflow view: Performance by step inside the workflow
Two Types of Metrics You’ll See
Journey metrics (campaigns)
These show how people move through the workflow.
Common journey metrics include:
-
Triggered
-
Started
-
Messaged
-
In progress
-
Completed
-
Filtered out
-
Exited early
-
Converted (if you set a goal)
Journey metrics help answer: Are people moving through the workflow the way we expected?
Message metrics (campaigns and broadcasts)
These show how individual messages performed.
Common message metrics include:
-
Sent / Delivered
-
Opened (email)
-
Clicked
-
Converted (if a goal is set)
-
Unsubscribed
-
Failed / Bounced / Suppressed (email)
Message metrics help answer: Did the message reach people, and did they engage?
Note: Broadcasts (newsletters) generate message metrics, not journey metrics.
How Dates Work (Important)
Metrics are reported based on the date a journey or a message was created — not always the date someone opened or clicked.
So a campaign journey may show a conversion on the day the person entered the workflow, even if they converted after later messages.
Understanding the Overview Page
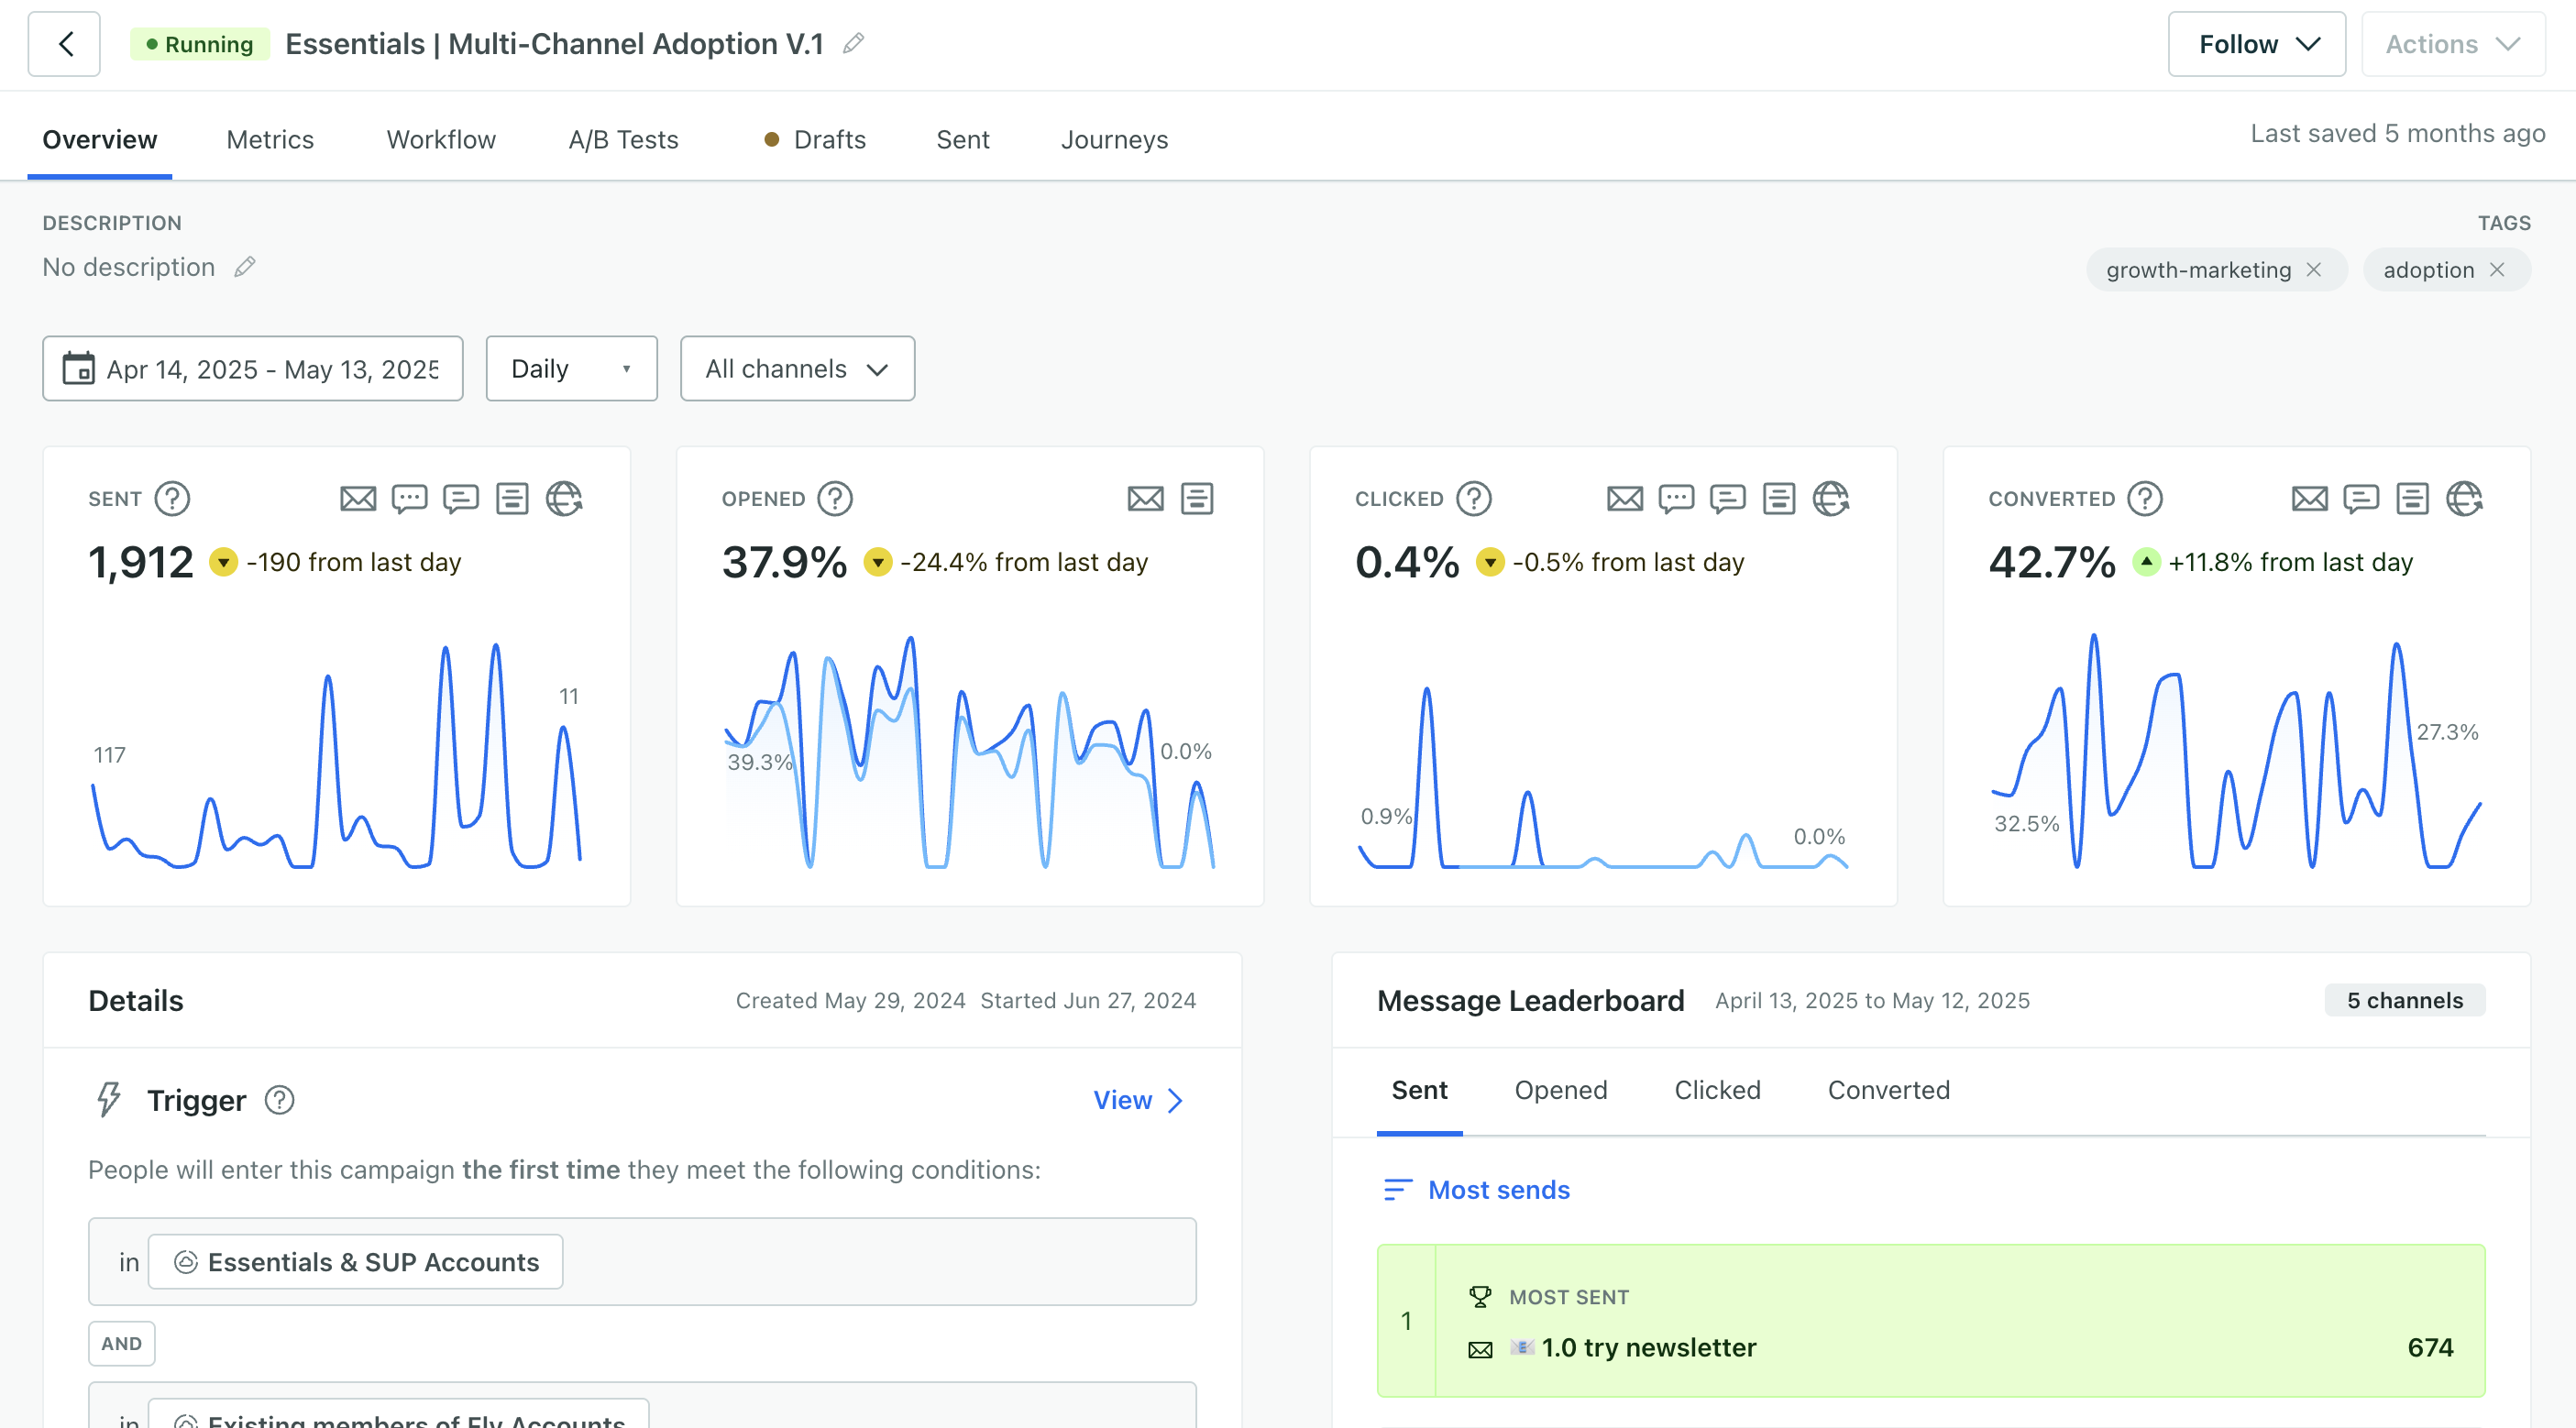
On a campaign’s Overview page, you’ll typically see charts for:
-
Sent / Delivered: volume and deliverability
-
Opened (email only): engagement, but can be affected by email privacy tools
-
Clicked: link engagement (only tracked links count)
-
Converted: results against your goal (only shows if a goal is configured)
If a chart is blank, it usually means:
-
Open tracking is off (for Opened)
-
No tracked links exist (for Clicked)
-
No goal is set (for Converted)
Message Leaderboard
The Message Leaderboard on the Overview tab shows how individual messages in your campaign performed relative to one another.
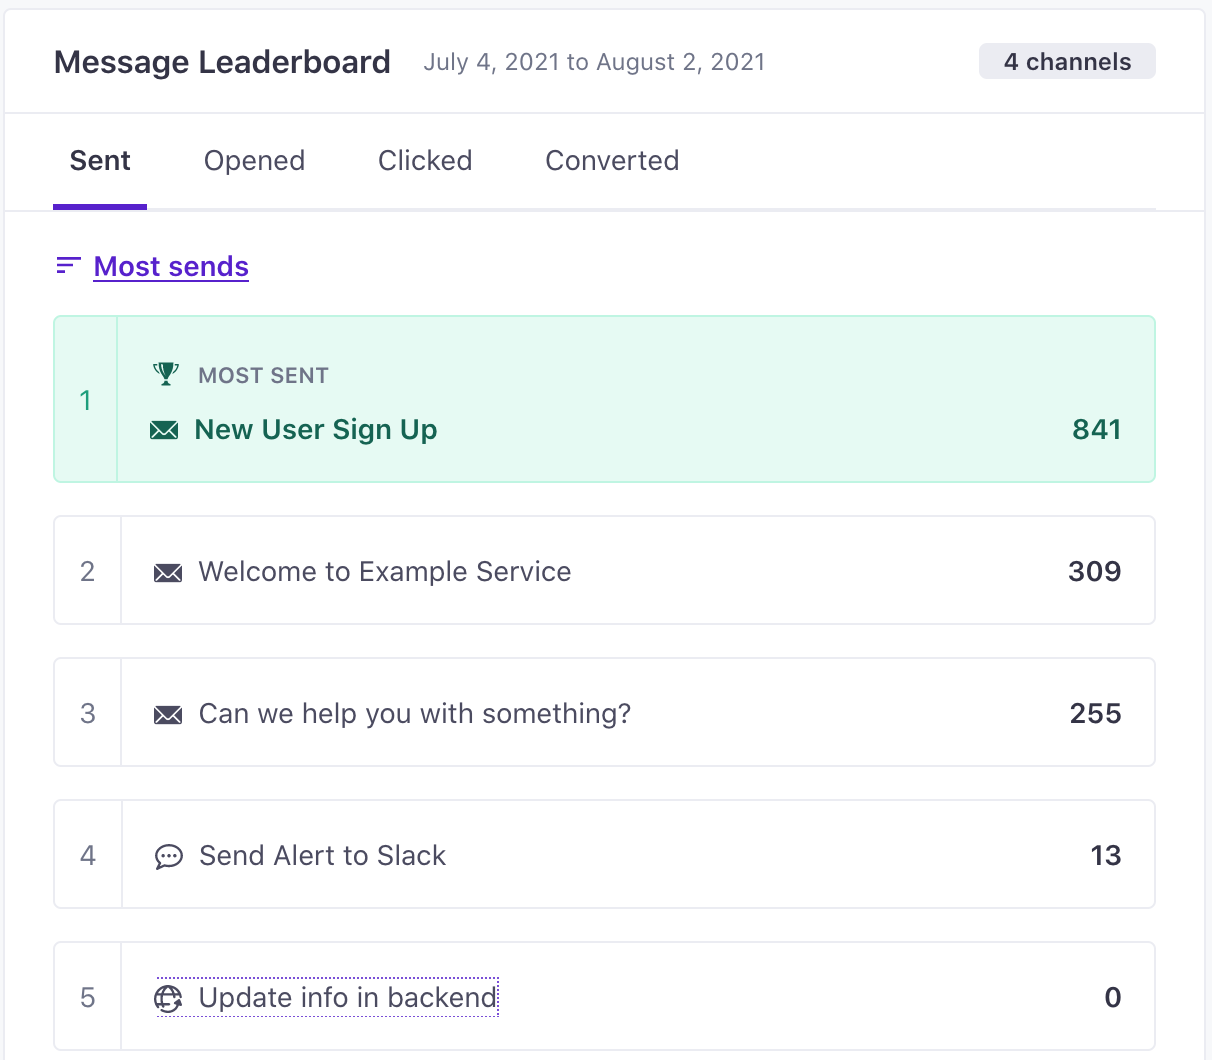
You can sort messages by:
-
Sends
-
Opens
-
Clicks
-
Conversions
This makes it easy to identify:
-
Which message drives the most engagement
-
Which step in a sequence underperforms
-
Where optimization efforts should focus
If your campaign includes multiple channels (email, SMS, etc.), the leaderboard reflects performance across the channels used in that campaign.
For campaigns running A/B tests, results for each variant are also shown, with the leading variant clearly marked.
The Metrics Tab: What to Look At
The Metrics tab is where you can dig deeper.
You can:
-
Change the date range
-
Switch between percentage and raw counts
-
Compare delivery metrics by channel
-
Review journey metrics to see funnel movement
-
View message-level performance in the message metrics table
Metrics in the Workflow View
In the Workflow tab, you can turn on “Measure” to see performance stats on each step of your workflow.
This is useful for spotting:
-
Which message step gets the most clicks
-
Where people drop out
-
Which branch path performs best